Bitcoin miners are nearing capitulation due to shrinking profit margins and increased BTC sell-offs. Since the halving, miners have seen a 63% drop in daily revenues. As a result, miners are forced to sell their reserves.
According to CryptoQuant, a market intelligence firm, Bitcoin miners are showing signs of giving up, similar to what happened after the FTX crash in late 2022. This could mean that Bitcoin (BTC) might be reaching a low point.
Miner capitulation means some miners are reducing their operations or selling some of their Bitcoin to stay in business or manage their risks.
During this time, Bitcoin’s price dropped by 13%, from $68,791 to $59,603. One major sign is a drop in Bitcoin’s hash rate, which is the total computing power that secures the Bitcoin network.
This situation is very similar to late 2022, when the market hit rock bottom after the FTX crash.
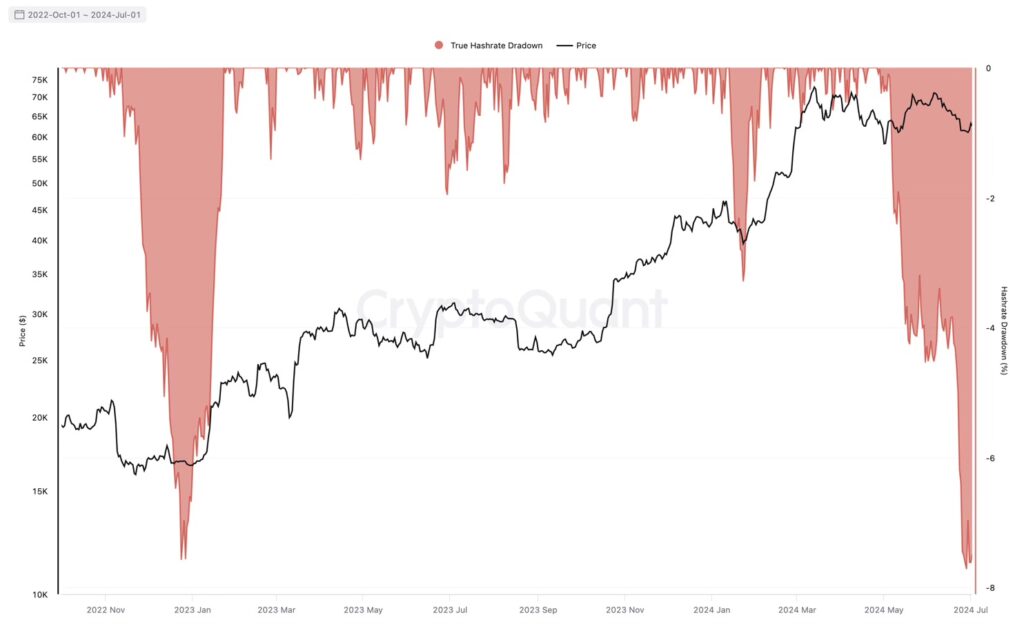
The CryptoQuant graphic shows several signs that miners are struggling. One major sign is a 7.7% drop in the hash rate since the halving, indicating that it’s becoming harder for miners to continue their work. The hash rate, which measures the total computing power of the Bitcoin network, usually falls when the market is doing poorly. Now, the hash rate has reached a four-month low of 576 EH/s after hitting a record high on April 27.
This suggests that miners might face even tougher times ahead, but it could also mean good opportunities for investors looking to buy Bitcoin at a lower price.
Early signs of miner capitulation
When bitcoin miners start to give up, savvy investors often see it as a good time to buy. This is because when miners have to sell their BTC to cover costs, it pushes the price down.
However, this sell-off can also mean the market is hitting its lowest point, setting the stage for a possible recovery. Data from CryptoQuant shows that miners are selling their Bitcoin reserves faster than before.
Daily BTC outflows from miners’ wallets are at their highest since May, showing a big sell-off.
This trend suggests that miners, struggling with falling revenues, would rather sell their assets than keep operating at a loss.
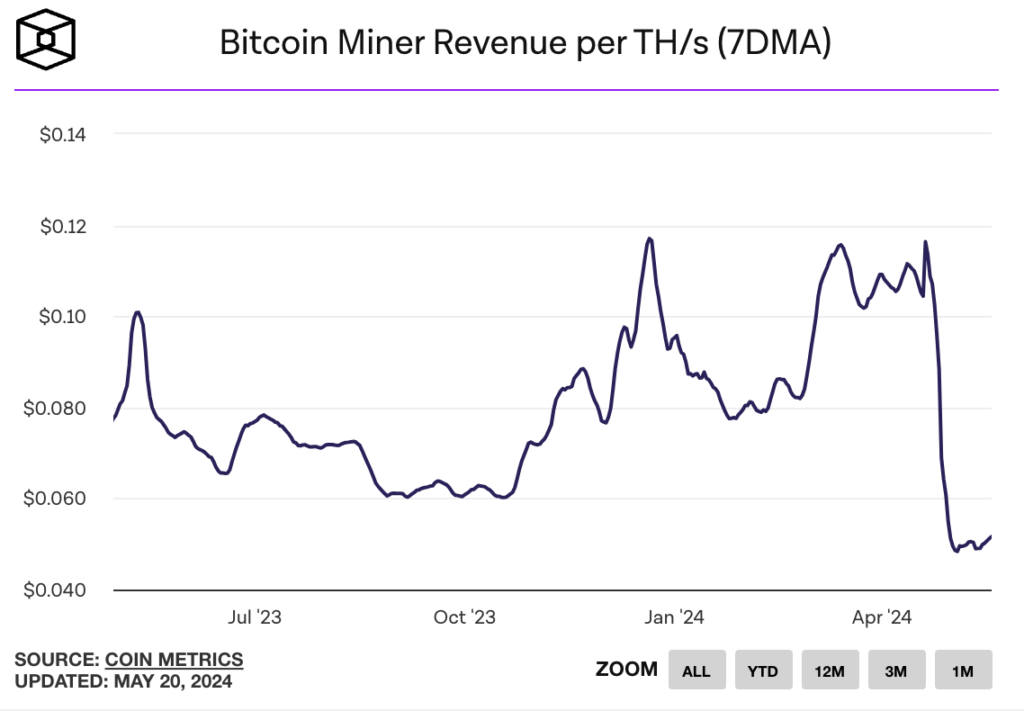
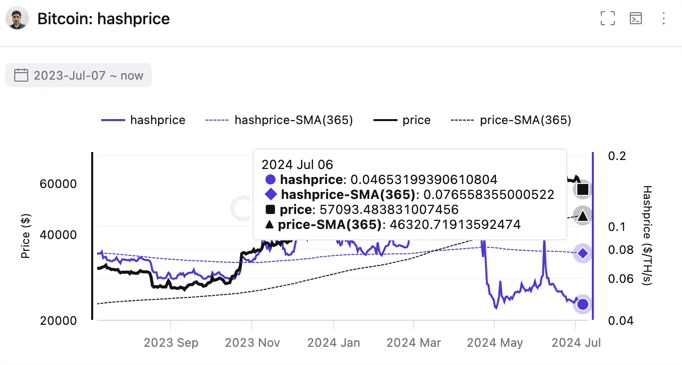
The “hash price,” which measures how much miners earn per unit of computing power, has also fallen to very low levels. Right now, the average revenue per hash is $0.046 per EH/s, just slightly above the all-time low of $0.045.
This drop in profitability makes things even harder for miners, forcing them to shut down operations and sell their bitcoins, adding more pressure on the market.
As miners give up, bitcoin might find a new bottom before bouncing back.
Bitcoin’s hashrate decline
Notably, the 7.7% decline in hashrate is similar to what happened in late 2022, when Bitcoin’s price hit a low of $15,500 before rising over 300% in the next 15 months.
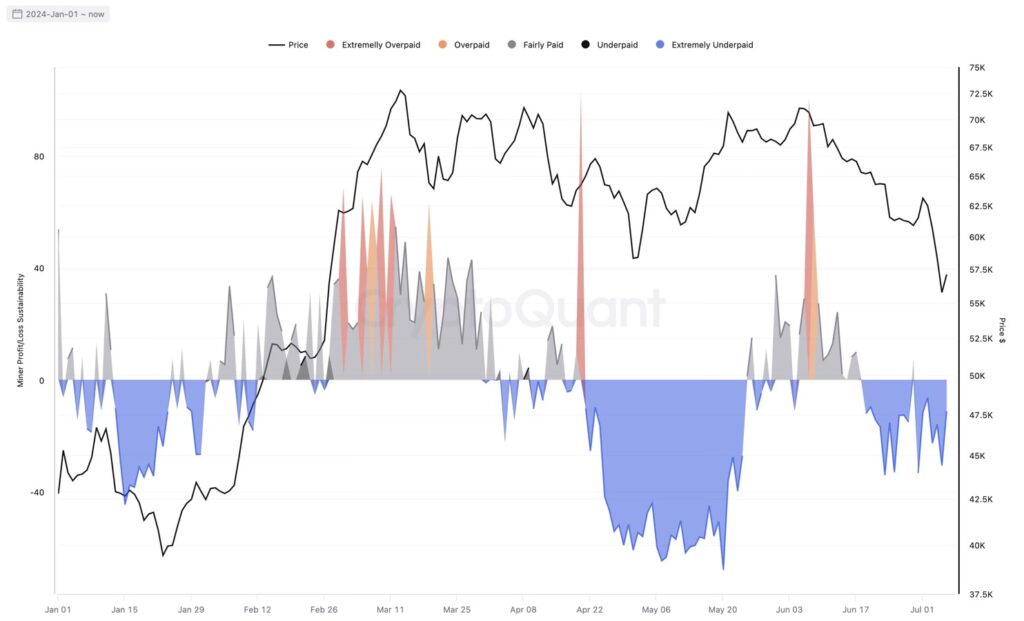
The CryptoQuant report mentioned that since the halving, miners have been extremely underpaid, as shown by the miner profit/loss sustainability indicator.
As a result, miners have seen a 63% drop in daily revenues since the halving when both Bitcoin’s block rewards and transaction fees were higher.
Total daily revenues have decreased from $79 million on March 6 to $29 million now.
Additionally, revenue from transaction fees has dropped to only 3.2% of the total daily revenues, the lowest since April 8.
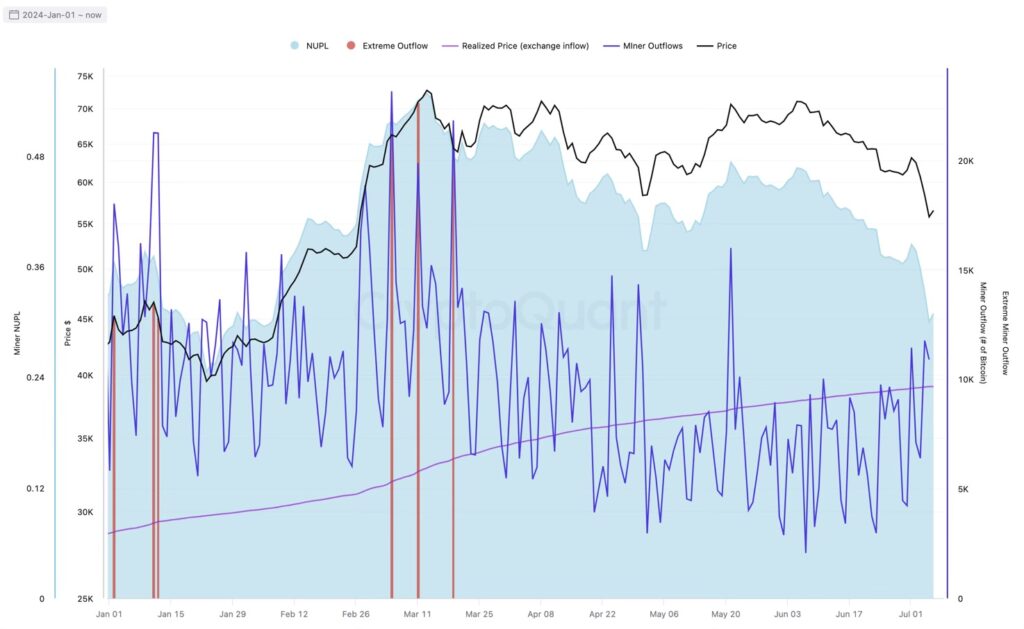
Source: Daily Bitcoin miner outflows, CryptoQuant
Due to these decreased revenues, Bitcoin miners have had to use their reserves to earn yield. Daily miner outflows have surged to the highest level since May 21, suggesting they might be selling their BTC reserves.
This sell-off by miners, along with sales from Bitcoin whales and national governments, has contributed to Bitcoin’s recent price drop, reaching a four-month low of $53,499 on July 5.
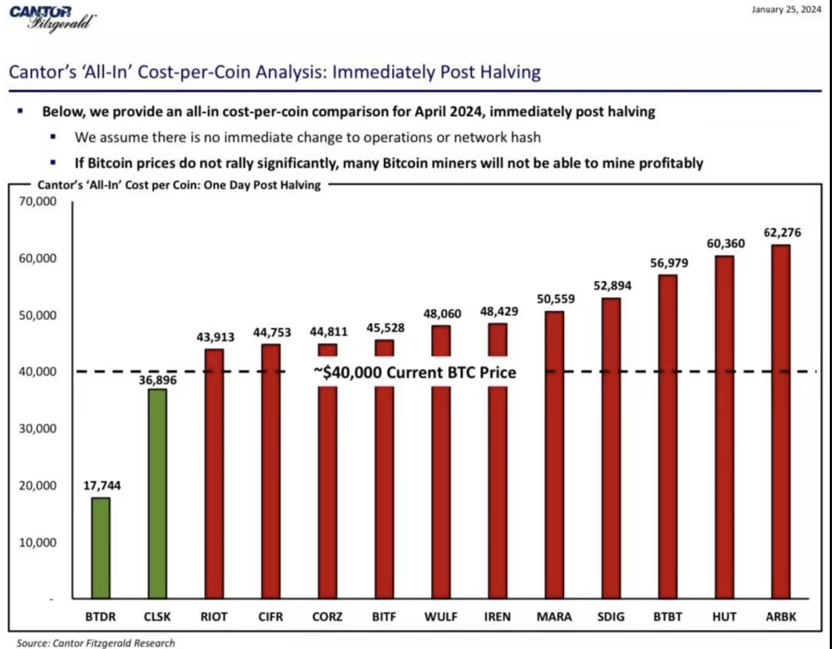
An earlier report by financial services firm Cantor Fitzgerald noted that some of the world’s largest mining companies might be forced to give up if Bitcoin’s price falls to $40,000, highlighting the tough situation for the mining industry.
Bitcoin has recently experienced significant sell-side pressure, leading to a substantial price drop and declining investor confidence.
Bitcoin‘s price has faced increasing sell-side pressure, causing it to drop by over 5.5% in the past week, reaching a six-week low of $58,400 on June 25. According to market intelligence firm Glassnode, this decline pushed BTC below its short-term cost basis, indicating a potential for a deeper correction.
What is the cost basis?
The cost basis is the original value or purchase price of an asset. In this context, it helps determine whether Bitcoin holders are currently in profit or loss.
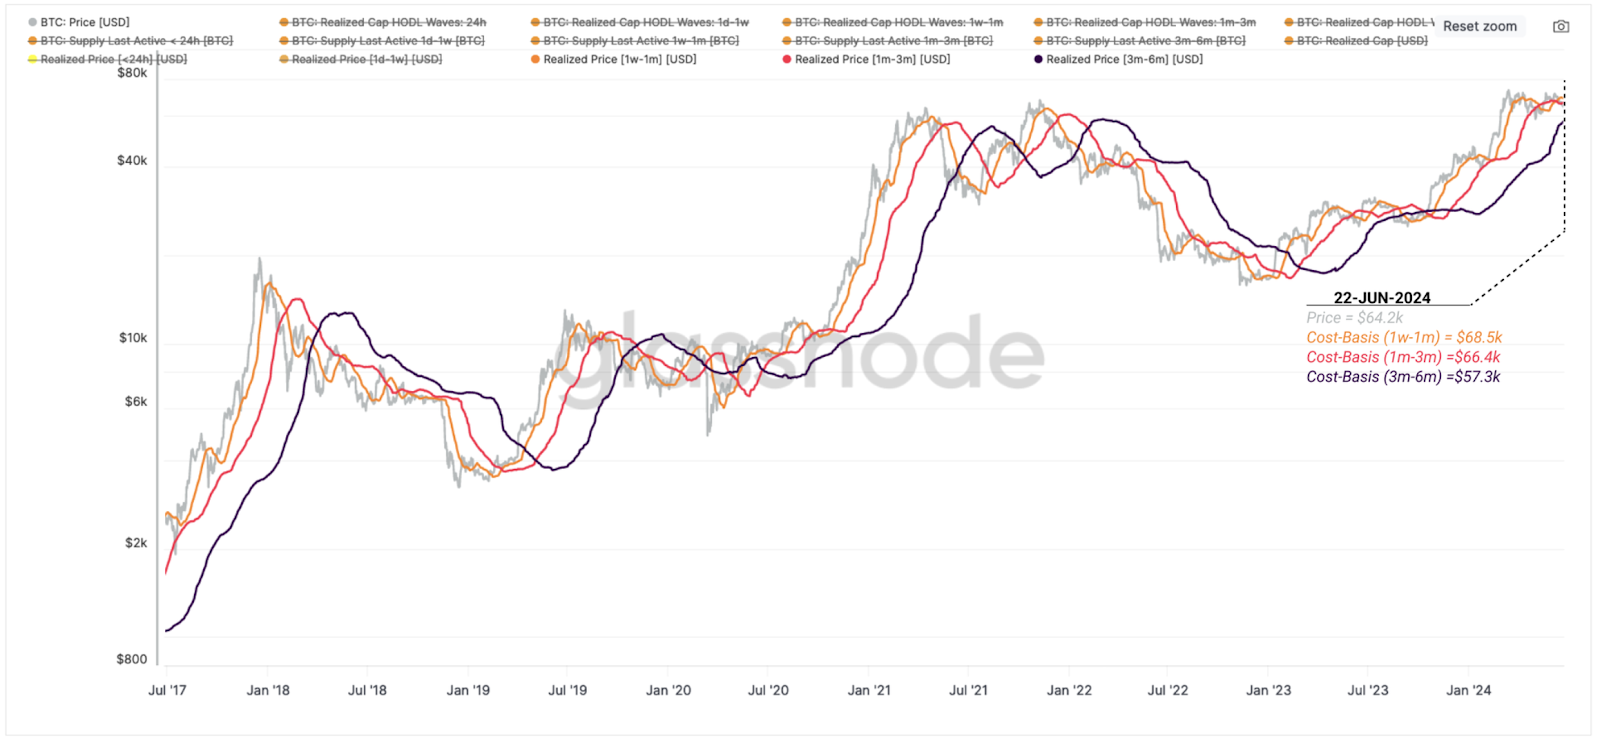
“Since mid-June, the spot price has fallen below the cost basis for both 1-week to 1-month holders ($68.5k) and 1-month to 3-month holders ($66.4k),” Glassnode reported in its “Week On-chain” newsletter published on June 25. “If this trend continues, it could lead to a further decline in investor confidence, making the correction deeper and recovery slower.”
Bitcoin realized price by cohort. Source: Glassnode
The short-term holder (STH) cost basis, or realized price, is a metric that indicates the average purchase price of Bitcoin for investors who have held their coins for less than 155 days.
Understanding investor behavior is crucial in assessing the dynamics of the Bitcoin market.
Short-term holders, those who have kept their coins for less than 155 days, tend to react more quickly to market fluctuations.
When Bitcoin’s price falls below its average purchase price or cost basis, it often triggers panic selling as these investors seek to minimize their losses.
This can lead to a cascading effect, further driving down the price.
In contrast, long-term holders who have held their coins for more than 155 days typically have a higher cost basis and are more resilient to short-term price volatility. Their investment strategies are often rooted in long-term growth expectations, making them less likely to sell during market downturns.
The recent market trends highlight a worrying shift in investor sentiment.
The fact that the cost basis for short-term holders has fallen below that of mid-term holders (1 to 3 months) signals weakening demand and a net outflow of capital from Bitcoin.
Such a structure has historically led to deeper corrections and prolonged recovery periods. The current market environment, characterized by significant outflows from Bitcoin ETFs and a general decline in investor confidence, mirrors patterns observed in previous market cycles where similar negative capital flows resulted in substantial price declines.
According to data from LookIntoBitcoin, when BTC dropped below the $64,000 mark on June 23, it fell below the STH realized price, which was $64,591 at that time.
Furthermore, the recent price drop nearly brought Bitcoin below the cost basis for holders of 3 to 6 months, which is $57,300.
This cost basis is still increasing despite the falling price. The report also notes that the cost basis for 1-week to 1-month holders has fallen below that of 1-month to 3-month holders. This indicates a decline in demand and a net capital outflow from Bitcoin.
Investor confidence and market trends
“During previous bull markets, a negative capital flow structure has happened up to five times. This pattern has been present since May and continued into early June,” the Glassnode report states.
Spot Bitcoin ETFs are experiencing an increase in inflows. On June 25, the 10 U.S.-based spot Bitcoin exchange-traded funds (ETFs) saw inflows totaling $31 million, breaking a seven-day streak of outflows.
According to SoSo Value, Fidelity’s ETF FBTC led the way with $49 million in net inflows on June 25. It was followed by the Bitwise Bitcoin ETF BITB, which saw $15 million in inflows, and the VanEck Bitcoin Trust ETF HODL, which had $4 million in net inflows.
Total Bitcoin spot ETF net inflow. Source: SoSo Value
Contrasting Trends in ETFs
On the other hand, the Grayscale ETF GBTC experienced a single-day outflow of $30.2 million, while the ARK 21Shares Bitcoin ETF saw $6 million in net outflows.
As of the end of June 2024, the ten spot Bitcoin funds that started trading on January 11 have accumulated net inflows of $14.42 billion, managing over $53.56 billion in assets. The significant outflows observed over the past few weeks are the highest since April, when spot Bitcoin ETFs recorded net outflows exceeding $1.2 billion between April 24 and early May.
There are five key on-chain indicators that suggest a bullish outlook for the price of Bitcoin. With market dominance above 54% and miner revenue per hash still strong, the data points to more potential gains ahead.
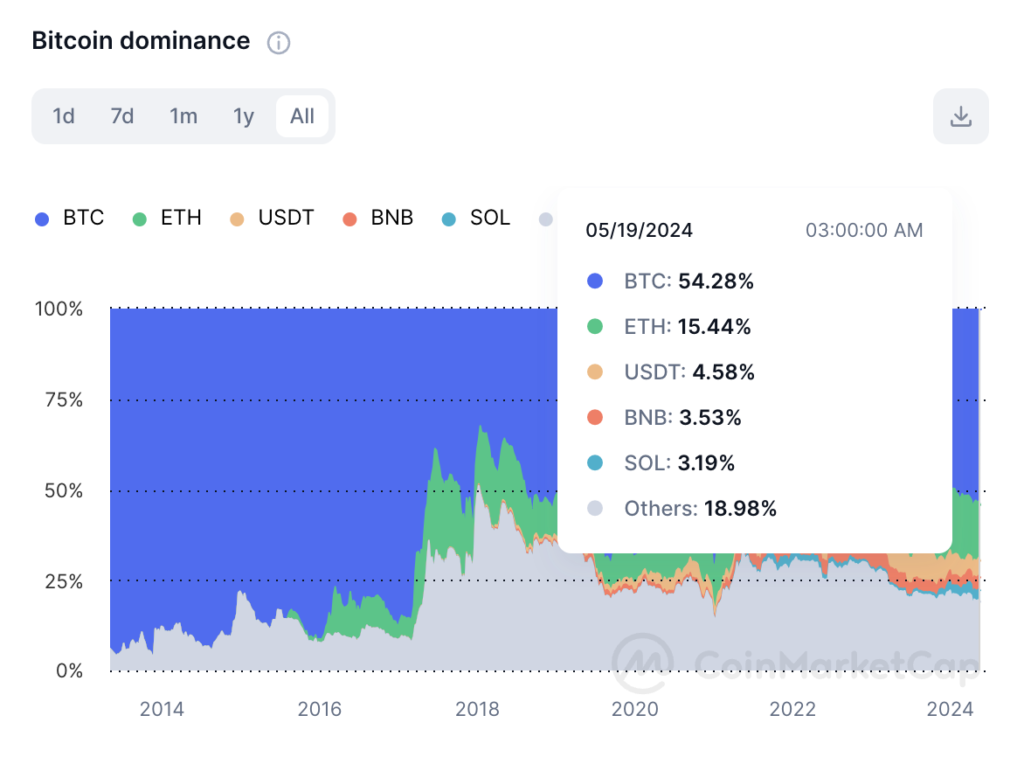
Bitcoin market dominance is above 56%
Historically, when Bitcoin (BTC) dominates the crypto market, it’s often a sign of a bull market. Traders typically sell their altcoins during bear markets, which increases Bitcoin’s market share.
Conversely, when Bitcoin’s dominance drops and the altcoin season begins, it indicates that the bull market is nearing its end.
As of May 2024, according to CoinMarketCap, Bitcoin’s dominance is still high at over 54%. Since October 2023, Bitcoin’s market share has remained above 50%.
Bitcoin’s market dominance and its correlation to a period of bull run
In mid-2015, after a prolonged bear market, Bitcoin’s dominance increased from around 40% to over 60%, which preceded the 2016-2017 bull run.
In 2017, Bitcoin’s dominance rose from 37% in January to 66% by June, before the famous bull run that culminated in Bitcoin reaching nearly $20,000 by December.
After the 2018 bear market, Bitcoin’s dominance grew from around 33% in January 2018 to over 70% by September 2019, preceding the 2020-2021 bull run.
During the market recovery in early 2019, Bitcoin’s dominance steadily climbed from around 50% in January to over 70% by September.
In late 2020, Bitcoin’s dominance surged above 50%, signalling the start of a major bull run that saw Bitcoin’s price rise from around $10,000 in September 2020 to over $60,000 by April 2021.
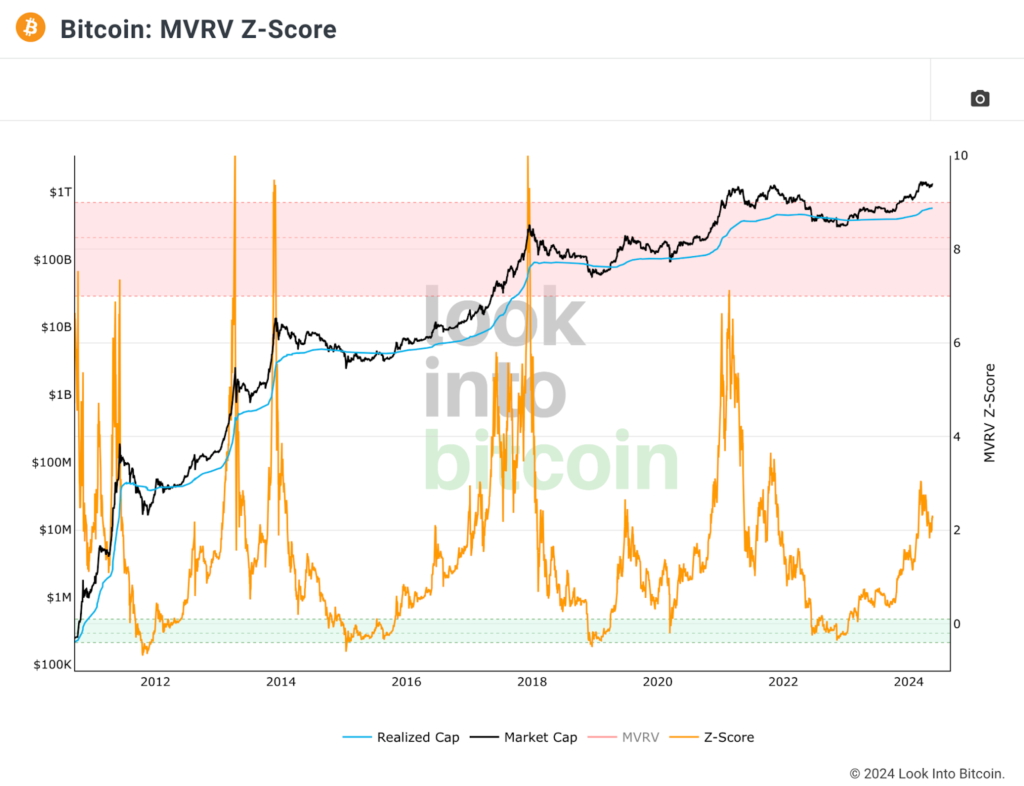
Bitcoin MVRV Z score under six
The Bitcoin Market Value to Realized Value (MVRV Z) score is a measure that compares Bitcoin’s current market value to its historical average.
This score tends to peak around six during market cycles. Currently, the MVRV Z score is below three and hasn’t exceeded six since March 2021, according to LookIntoBitcoin.
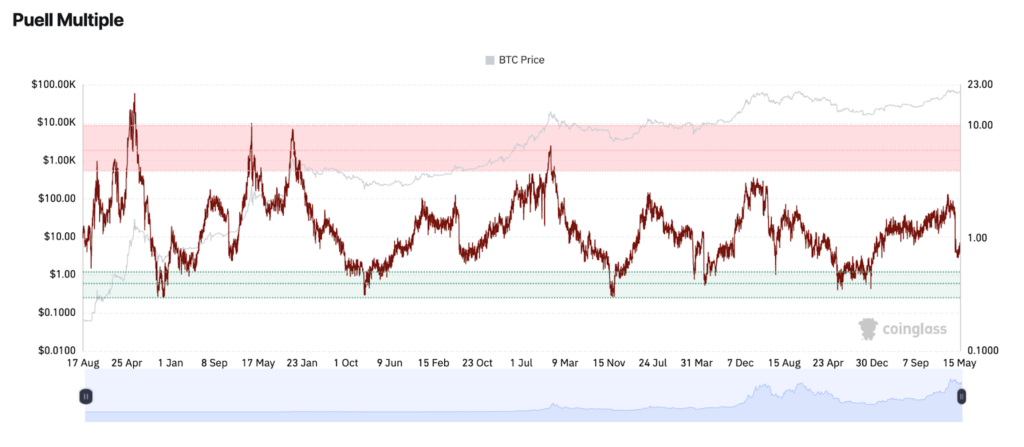
The Puell Multiple is another indicator used to identify market cycle peaks. It’s calculated by dividing the daily value of Bitcoin mined by the yearly moving average of that value.
According to Coinglass, the Puell Multiple fell below one after the halving on April 20. Peaks above three are usually seen at cycle tops, and the highest it reached during the 2024 price surge in mid-March was 2.4.
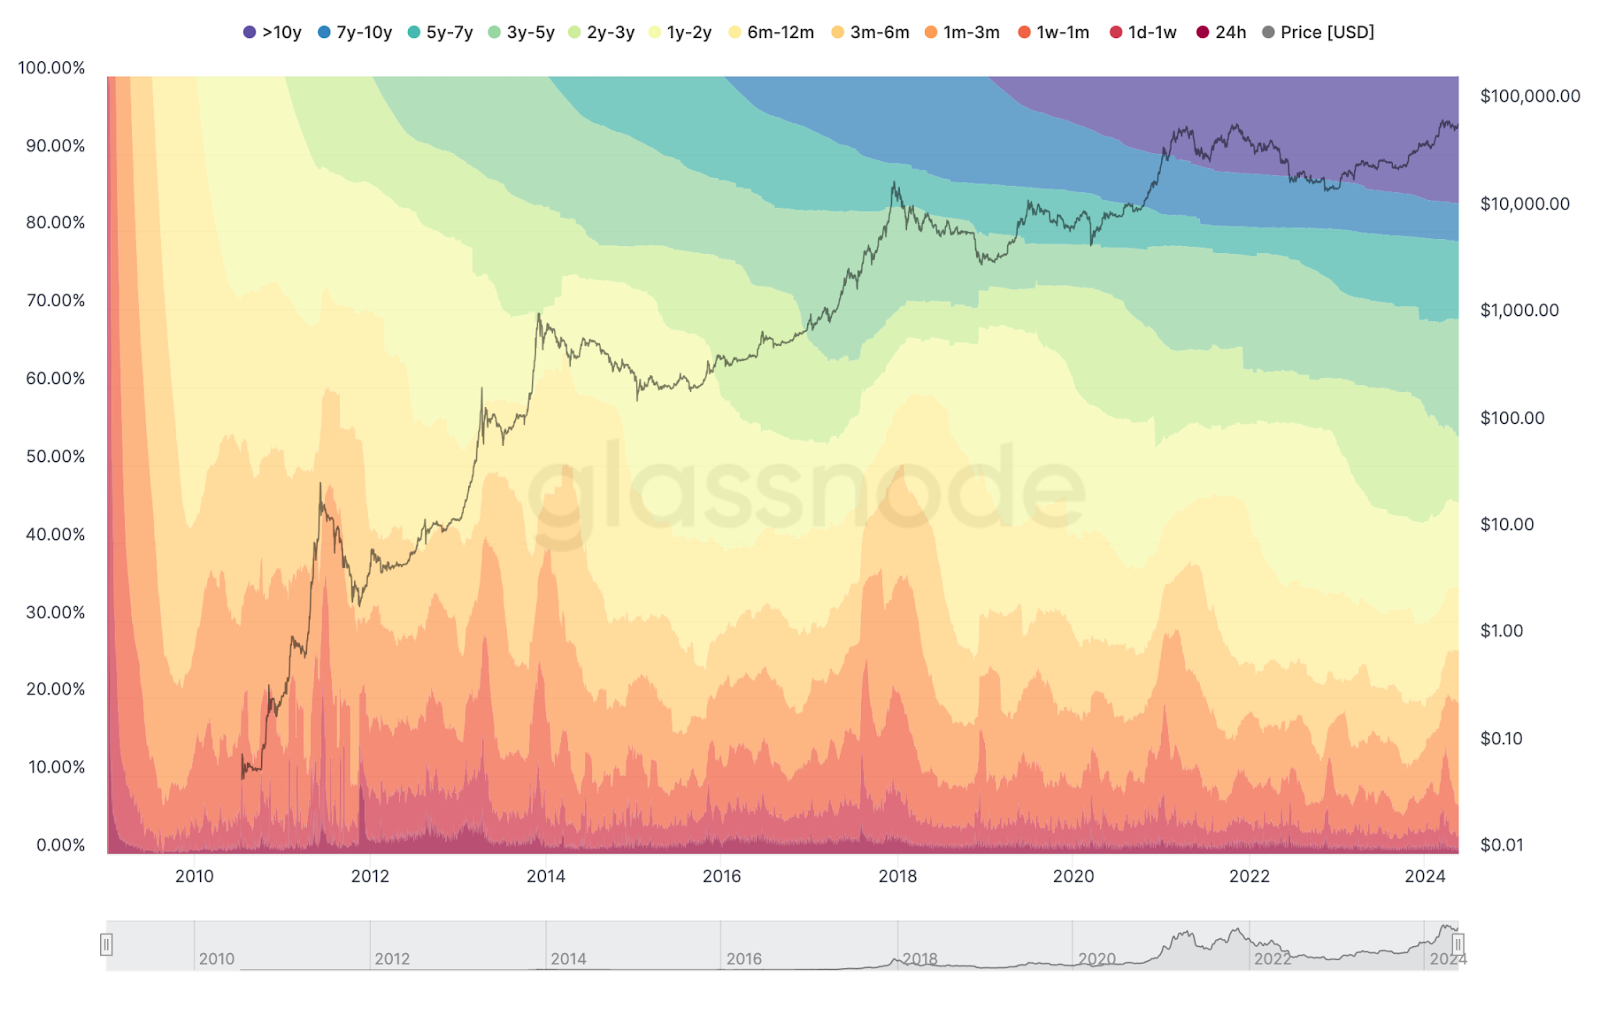
Charts that analyse the amount of Bitcoin held by different groups, known as hodl waves, also suggest a bullish outlook for Bitcoin.
Realized cap hodl waves provide insights into how much Bitcoin is held by recent buyers versus long-term holders. A decline in peaks among newer holders indicates that selling pressure might have lessened, potentially paving the way for further gains.
Source: Glassnode
Bitcoin miner revenue per hash
Another bullish indicator is the miner revenue per hash, which tracks how much money Bitcoin miners earn.
A terahash (TH/s) is a unit of measurement used in cryptocurrency mining to indicate the speed at which a computer can process complex calculations. Specifically, it represents one trillion (1,000,000,000,000) hash calculations per second.
The higher the terahash rate, the more calculations a miner can perform, increasing the chances of successfully mining a block and earning rewards.
Although this metric tends to decline as network difficulty increases, past spikes to $0.3 per terahash have coincided with market peaks. Currently, it suggests miners are still profiting well.
Despite these bullish signals, some metrics suggest the market might be overheating. The Realized Hodl (RHODL) ratio compares the price of recently bought Bitcoin to that of Bitcoin bought one to two years ago.
If new buyers are paying significantly more than long-term holders, it could indicate a market peak. This ratio signalled a peak in March.
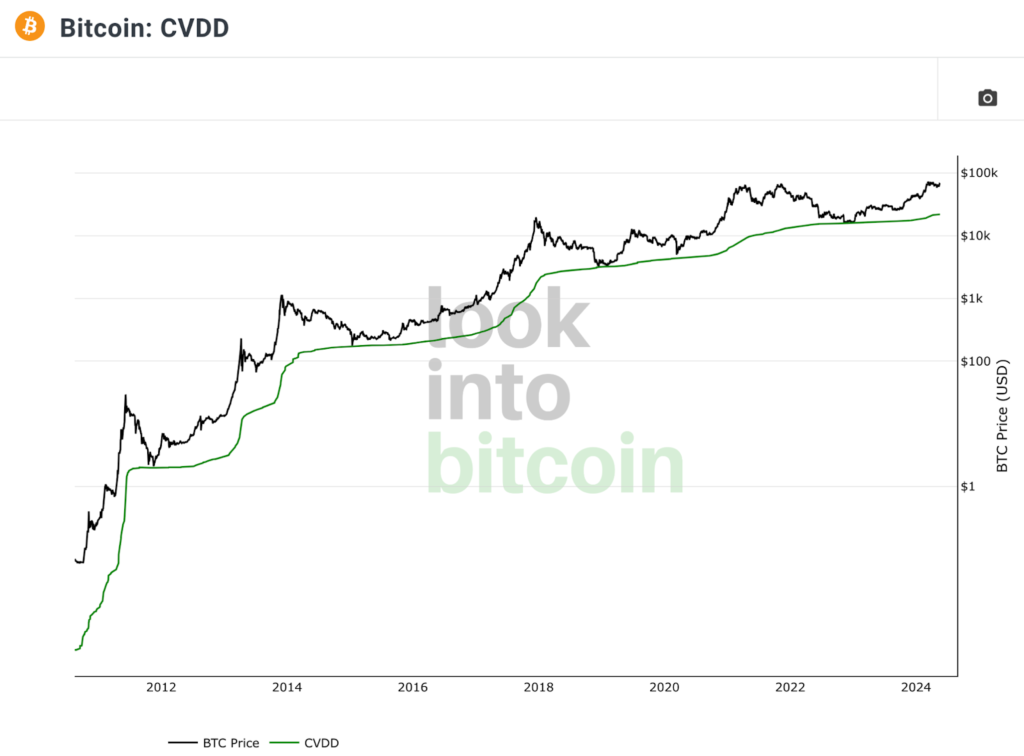
The Cumulative Value-Days Destroyed (CVDD) metric also appears to have peaked.
CVDD measures the cumulative value of Bitcoin moved from older hands to new hands relative to the market age. A sudden movement of old coins can signal a market peak.
Source: LookIntoBitcoin
What’s next for Bitcoin’s price?
Given the current on-chain indicators, it looks like Bitcoin’s price is set to continue rising. High market dominance, favourable MVRV Z score, Puell Multiple, hodl waves, and miner revenue all suggest a bullish trend.
Although some metrics hint at a potential market peak, the overall data indicates that Bitcoin’s price is likely to see further gains before any significant downturn.
As Bitcoin goes through its 4th pivotal halving event, the landscape of cryptocurrency has transformed significantly. This new financial territory brings key changes and developments surrounding Bitcoin’s halving, from the unprecedented pre-halving price surges to the enhanced global decentralisation and security of its network
Bitcoin halving has catalysed a surge in crypto adoption
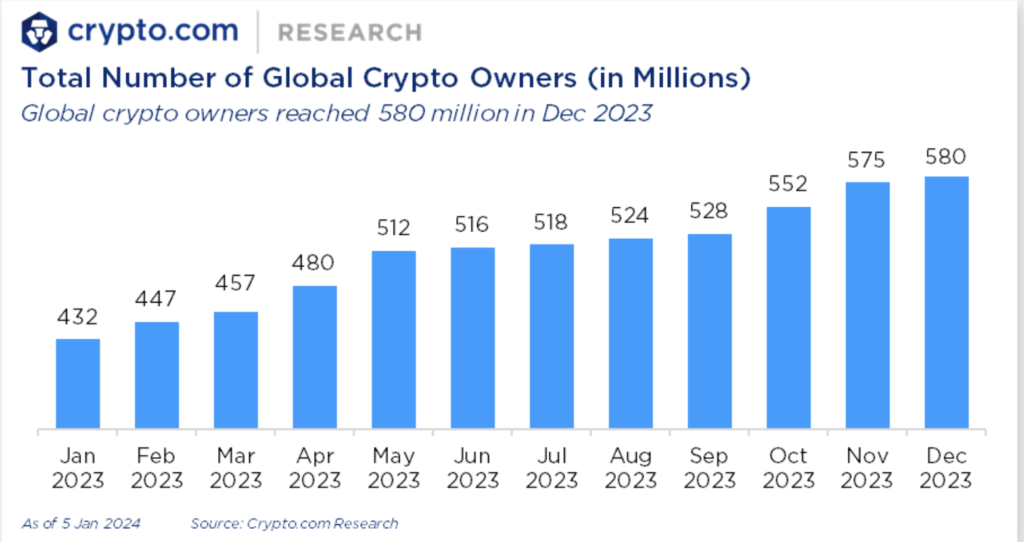
Since the Bitcoin halving event in May 2020, the number of people using cryptocurrencies worldwide has skyrocketed by at least 400%, growing from about 100 million to nearly 580 million users by the end of 2023.
This dramatic increase in user base is drawn from estimates by the Cambridge Centre for Alternative Finance and Crypto.com.
Although the rate at which new Bitcoins are generated has slowed down due to the halving process, global interest and adoption of cryptocurrencies have not decreased.
As of early 2024, data suggests that roughly 2.7% of the world’s population owns Bitcoin, amounting to about 219 million individuals.
This represents a significant rise—approximately 208%—from the 71 million Bitcoin users estimated four years earlier. It’s important to note, however, that these figures are estimates; accurately gauging the exact number of Bitcoin or other cryptocurrency users is challenging.
Factors like the inability of on-chain transaction analysis to distinguish between active users, long-term holders, and lost coins make precise counts difficult.
The 2024 pre-halving period has shown unprecedented growth in Bitcoin’s price, marking a distinct difference from the previous three halving events.
Historically, significant price surges in Bitcoin occurred after the halving, with new all-time highs typically forming about a year later.
For instance, before the 2020 halving, Bitcoin did not surpass its previous peak of $20,000. It only exceeded this mark 10 months post-halving.
However, the scenario has dramatically changed in the current cycle.
Bitcoin achieved a new all-time high just before the upcoming halving, hitting a record price of $73,600 on March 13, 2024. This kind of price action prior to a halving is unprecedented and has been noted by several analysts.
How Bitcoin miners are better positioned ahead of the 2024 halving
This time around, the unprecedented surge in Bitcoin’s price before the halving may have bolstered the mining industry, granting miners greater control over their operational costs.
Miners seem to be in better financial standing compared to previous halving cycles, with reduced debt levels and improved cost management, particularly in electricity expenses.
Moreover, the price appreciation preceding the halving is a novel occurrence in Bitcoin’s history, providing an additional boon to miners.
Since the third halving in May 2020, Bitcoin’s mining energy consumption has notably risen, reaching 99 Terawatt hours (Twh) by April 18, 2024. Despite this increase, there’s a positive trend in the utilisation of renewable energy sources for Bitcoin mining, accounting for 54.5% of the network’s energy consumption as of January 2024, up from 39% in September 2020, according to Bitcoin ESG Forecast and CCAF data, respectively.
The first Bitcoin halving with active spot ETFs in the U.S.
The 2024 Bitcoin halving stands out as the first to occur alongside active spot Bitcoin ETFs (exchange-traded funds) in the United States, marking a significant evolution in Bitcoin investment accessibility.
These ETFs, which began trading in January 2024, have opened the doors for institutional investors to engage more directly with Bitcoin.
Bloomberg’s ETF analyst, Eric Balchunas, reported that these spot Bitcoin ETFs have achieved “blockbuster success,” indicating a sharp rise in Bitcoin demand. Since their inception, the combined holdings of all ten spot Bitcoin ETFs have increased by at least 220,000 BTC, valued at approximately $14 billion.
Missed this earlier but looks like BlackRock and Pimco have filed for mutual fund to ETF conversions, joining about 70 funds so far with $100b to convert. MF cos looking to exploit all three roads to ETFville: clones, conversions and classes = bullish https://t.co/fqzMCG8cj5
Among these, BlackRock’s spot Bitcoin ETF has seen the most substantial inflows, with its holdings skyrocketing more than 10,000% from an initial 2,621 BTC to 273,140 BTC as of April 18.
As for the broader market dynamics, while the halving is significant, it should be viewed as part of a larger narrative that includes ETFs, quantitative easing, and other factors shaping the market’s future.
Bitcoin’s global decentralisation and enhanced security
Bitcoin’s network has seen substantial improvements in security and decentralisation over the past few years.
Previously concentrated primarily in mainland China, where nearly 80% of the mining activity took place as of 2020, the Bitcoin mining landscape has now become significantly more global.
As of February 2024, the United States leads with 40% of the total mining hash rate, followed by China and Russia, which contribute 15% and 12%, respectively, according to Hashlab Mining.
This shift toward geographic decentralisation continues as miners explore regions like Africa and Latin America, which are attracted by lower electricity costs.
Moreover, the security of the Bitcoin blockchain has dramatically increased; its hash rate has quintupled since the last halving, making the network much more robust against attacks.
Now, it requires five times more computing power and associated resources such as electricity, infrastructure, and hardware to pose a threat to the network.
Explore the intricate interplay between Bitcoin’s price movements, economic indicators, and trader behaviors in this detailed analysis.
As the cryptocurrency market approaches a pivotal moment with the upcoming Bitcoin halving, understand the factors influencing price trends, including leverage risks, regulatory impacts, and broader economic conditions.
Gain insights from expert predictions and strategies to better understand how global financial trends and internal crypto dynamics could shape the future of Bitcoin’s valuation.
Exploring the Link Between Bitcoin, S&P 500, and Economic Indicators
The relationship between Bitcoin‘s price movements, the S&P 500 index, and broader economic indicators is a complex interplay that reflects broader market sentiment and investor behaviour. This connection can be understood through several key dynamics:
Market sentiment and risk appetite
Bitcoin and the S&P 500 often react similarly to changes in global market sentiment.
During times of economic optimism, both markets tend to rise as investors are more willing to take on riskier assets. Conversely, economic downturns or market uncertainties often lead investors to pull back from both equities and cryptocurrencies, which are considered risk assets.
For example, significant drops in the S&P 500 due to economic fears or poor corporate earnings often coincide with declines in Bitcoin’s value as investors seek safer holdings.
Inflation and Monetary Policy
Bitcoin has been characterised by some investors as a “digital gold,” akin to a hedge against inflation.
The cryptocurrency’s limited supply contrasts with fiat currencies that can be printed without limit. When inflation fears rise, as indicated by economic indicators like CPI (Consumer Price Index), or when the Federal Reserve signals tighter monetary policy by raising interest rates, both the S&P 500 and Bitcoin can be affected. Stocks generally react negatively to high inflation and higher rates, which can also increase the appeal of Bitcoin as an alternative investment.
Liquidity and market dynamics
The Federal Reserve’s monetary policy also impacts liquidity in financial markets. Lower interest rates and quantitative easing generally increase market liquidity, making funds available for investment in both stocks and cryptocurrencies, leading to potential price increases in both markets.
Conversely, quantitative tightening reduces liquidity, which can lead to lower prices. Bitcoin’s reaction to these policies can be swift, mirroring or even exaggerating the movements seen in the S&P 500.
Investor behaviour and technological adoption
The increasing adoption of blockchain technology and the integration of cryptocurrencies into traditional finance (like Bitcoin ETFs and futures) further intertwine the performance of Bitcoin with traditional stock markets.
As institutional investors enter the crypto space, their investment behaviours — often driven by the same factors influencing their stock market investments — can lead to correlated movements between Bitcoin and the S&P 500.
Geopolitical and economic uncertainties
Global events such as geopolitical tensions, trade wars, or pandemics can influence both the stock market and Bitcoin prices.
For instance, during times of heightened uncertainty, there may be an increase in Bitcoin buying as a hedge against global instability, even as stock markets might falter due to risk aversion among traditional investors.
Understanding the nuanced relationship between Bitcoin, the S&P 500, and economic indicators not only helps in assessing the risk and opportunities inherent in both markets but also in strategizing investments that can withstand or capitalize on the interconnected volatility of these asset classes.
Trading crypto during this turbulent period
During this turbulent period in the crypto market, traders are expressing a mix of caution and strategic optimism. Here’s a snapshot of the prevailing sentiments and strategies among traders:
Caution over leverage. The recent liquidations of leveraged positions have served as a stark reminder of the risks involved. Traders are advising against over-leveraging and are emphasising the importance of risk management to withstand sudden price swings.
Don’t use leverage – at least not without a stop loss.
Using leverage is the only way to send your portfolio to 0, and to then miss out on the rest of the bull market.
If you are trading spot you’re down. So what. If you get liquidated you’re out of the game entirely.…
Market volatility. The unpredictable movements make it essential for traders to stay very active and responsive, adjusting their positions as the market changes.
Strategic patience. Experienced traders are advocating for a more cautious approach, suggesting that sitting out the high volatility might be wise. They believe that waiting for clearer signs or more stable conditions could prevent losses and lead to better opportunities in the future.
Market will go through a big shakeout.
Majority of alts are already down 40%-45% from their recent highs.
They'll most likely get to 50%-70% retracements across the board by the time we're done.
Optimism for post-halving gains. There is a strong sense of optimism regarding the upcoming Bitcoin halving. Some traders, like Andrew Kang of Mechanism Capital, predict that the reduced supply of Bitcoin resulting from the halving will lead to significant price increases, potentially reaching new all-time highs.
Diversification. With the current uncertainties, some traders are looking at diversifying their investments beyond just Bitcoin and Ethereum. They are exploring other cryptocurrencies and blockchain projects that might offer better stability or growth potential in the current environment.
Economic indicators. Traders are closely monitoring broader economic indicators, especially inflation rates and actions by the Federal Reserve, as these factors are seen as key drivers for both the stock market and cryptocurrency prices. Their strategies often involve adapting quickly to economic news that could affect market sentiment.
The second scenario, the impulsive wave: is that we roll over here and we are in the midst of a 5 wave impulsive move down, either way there's so much liquidity being formulated below is would seem pretty unlikely to me that we would not unlock all that liquidity from stop losses… pic.twitter.com/UCQr9iuNUh
As we navigate through a period of significant volatility and anticipation in the crypto market, various traders and analysts have shared their expectations for Bitcoin’s future. These insights combine optimism with caution, reflecting the complex factors influencing the market.
Post-halving surge
The upcoming Bitcoin halving is a focal point of discussion. Andrew Kang of Mechanism Capital is notably optimistic, predicting that Bitcoin’s price could ascend to new all-time highs, potentially reaching $80,000 by May. This optimism is grounded in Bitcoin’s historical performance following previous halvings, where reduced supply typically led to price increases due to the heightened scarcity of available coins.
Whale activities and market impact
The activity of Bitcoin whales—large holders capable of influencing market dynamics through substantial transactions—is also a key indicator to watch. Recent data suggest that whales are accumulating Bitcoin, possibly in anticipation of price increases post-halving. This trend could provide upward pressure on prices if it continues, signaling strong demand overcoming the reduced supply.
Economic indicators and external influences
Economic announcements, particularly regarding inflation and Federal Reserve policies, have recently impacted Bitcoin’s price.
Traders should continue to monitor these indicators as they provide a critical context for Bitcoin’s behaviour in relation to broader financial markets.
For instance, if inflation remains high, Bitcoin may increasingly be viewed as a hedge, similar to gold, which could boost its price further.
Volatility and trader behaviour
Despite the optimistic projections, seasoned traders like Honeybadger express a more cautious stance, suggesting potential price volatility could lead to unexpected market movements. This sentiment is echoed by others who advise against over-leverage and recommend waiting for more stable market conditions to avoid the risks of sudden price reversals.
Long-term trends
Looking further ahead, the integration of blockchain technology and broader financial acceptance of cryptocurrencies may bolster Bitcoin’s position as a mainstream asset. This could lead to greater stability and less susceptibility to sharp market movements compared to the current landscape.
Let’s delve into the world of decentralised stablecoins to get more clarity on a concept that marries cryptocurrency flexibility with traditional financial stability.
What is a stablecoin?
A stablecoin is a type of cryptocurrency designed to have a stable value, unlike other cryptocurrencies like Bitcoin or Ethereum, which can see their prices fluctuate wildly.
The idea behind stablecoins is to combine the best of both worlds: the stability of traditional money, like dollars or euros, and the flexibility and security of digital currencies.
Stablecoins achieve their stability by being pegged to something with a stable value, such as a widely used currency (like the US dollar) or a commodity (like gold). This means one unit of a stablecoin is meant to always be worth the same as the asset it’s tied to. For example, one stablecoin pegged to the US dollar aims always to be worth exactly one dollar.
This stability makes stablecoins particularly useful for people who want to use digital currency for everyday transactions, like buying coffee or sending money to friends, without worrying about the value of their currency going up or down dramatically in a short period.
It also makes them a popular choice for traders and investors in the cryptocurrency world who are looking for a safe place to store their assets during turbulent market conditions.
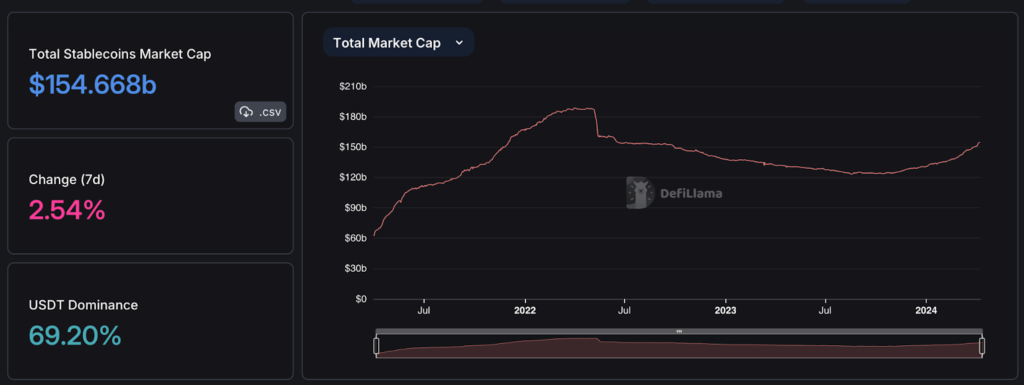
According to DeFiLlama, as of April 2024, the total stablecoins market cap has risen to $154.66 billion. However, this value includes both decentralised and centralised stables. The dominant stable is USDT, a centralised stablecoin.
USDT, or Tether, stands out in the cryptocurrency world due to its centralised nature, meaning it is issued and managed by a single entity, Tether Limited.
This central authority holds reserves in traditional fiat currencies, like the US dollar, to back and stabilise the value of USDT, ensuring that it remains pegged 1:1 with the dollar.
This centralisation contrasts with decentralised cryptocurrencies, where control is spread across a network of users. The centralised approach of USDT provides users with the perceived stability of traditional financial systems while enabling the flexibility of digital transactions.
However, it also introduces reliance on the trustworthiness and solvency of Tether Limited, making its transparency and regulatory compliance crucial to users’ confidence.
What is a decentralised stablecoin?
A decentralised stablecoin is a special kind of digital money that aims to keep its value steady, just like regular stablecoins.
What sets it apart is how it operates without being controlled by any single company or government. Instead, it uses a network of computers and sophisticated software to manage itself.
Imagine a community garden where everyone contributes and decides together how to take care of it, rather than one person owning it and making all the decisions.
In a similar way, decentralised stablecoins are managed by a community of users following rules written in computer code. These rules help keep the stablecoin’s value consistent, often by linking it to something stable like the dollar or gold.
This approach offers a couple of big benefits.
First, it can reduce the risk of a single point of failure, like if a company managing a stablecoin goes out of business.
Second, it promotes transparency and fairness, as everyone can see and understand how the stablecoin is managed.
Decentralised vs centralized stablecoins
Comparison criteria
Decentralised Stablecoins
Centralised Stablecoins
Control and Governance
Operate based on smart contracts and are often governed by community decisions or a DAO.
Managed by a single entity, such as a company, which is responsible for maintaining the stablecoin’s value and reserves.
Transparency and Trust
Transparency is provided by the blockchain and smart contracts, allowing public verification. Trust is placed in the code and the governance model.
Trust is placed in the issuing company to hold sufficient reserves, with varying degrees of transparency and external audits.
Reserve Management
Use other cryptocurrencies, algorithmic methods, or combinations thereof to maintain their peg, minimising reliance on traditional systems.
Typically backed by traditional assets (fiat currencies, gold, etc.), managed by the issuer.
Regulatory Oversight
Faces a complex regulatory landscape due to its distributed nature, which can both pose challenges and offer resistance to regulatory pressure.
They are more likely to be regulated and comply with financial laws, given their ties to traditional financial entities and assets.
Accessibility and Integration
It may offer innovative features within the DeFi ecosystem but might be less accessible to newcomers due to its complexity.
Often offer easier integration with traditional financial systems and are generally more accessible to the general public.
Top decentralised stablecoins
It’s important to note that most stablecoins used by crypto traders are mostly centralised stablecoins.
USDT (Tether), USDC (USD Coin), TUSD (TrueUSD), BUSD (Binance USD), and PAXG (Pax Gold) are generally considered centralised due to their backing by specific companies or organisations that maintain control over their issuance and backing reserves.
FRAX, DAI, and others like FDUSD, USDE, and XAUT offer more decentralised aspects. Here’s a closer look:
DAI – DAI is pegged to the US dollar and maintains stability through over-collateralization with cryptocurrencies on the Ethereum blockchain. It is governed by the MakerDAO protocol, allowing DAI holders to participate in decision-making.
FRAX – FRAX is a partially collateralised stablecoin that aims to provide a highly scalable and decentralised stablecoin solution. It operates on the Ethereum blockchain and maintains its peg through a combination of collateral and algorithmic mechanisms, adjusting its collateral ratio based on market conditions.
FDUSD(Fiat DAO) – FDUSD is part of the Fiat DAO ecosystem, aiming to provide a stable and decentralised currency solution. It is designed to work within the DeFi ecosystem, offering stability through mechanisms that allow it to respond to market dynamics, although detailed specifics about its pegging strategy and blockchain basis are less commonly known compared to more established stablecoins.
USDE – USDE (Ethena USDe) is an example of a decentralised stablecoin with unique mechanisms for maintaining its peg, often involving algorithmic approaches or community governance for stability. The specifics of its operation, including the assets it is pegged to and the native blockchain, can vary based on the project’s development and governance model.
XAUT (Tether Gold) – While Tether’s USDT is centralized, XAUT offers a different approach by being a digital token backed by physical gold. It represents one troy ounce of gold on a London Good Delivery bar. However, the management and issuance by Tether might still place it in a more centralized category compared to purely decentralized finance (DeFi) projects.
It’s important to distinguish between the operational models of these stablecoins, especially in terms of decentralisation and the mechanisms they use to maintain their peg.
If you intend to invest in crypto or store funds in decentralised stablecoins, consider using eToro, Binance or Wirex, three highly reliable centralised crypto platforms.


 Bitcoin realized price by cohort. Source: Glassnode
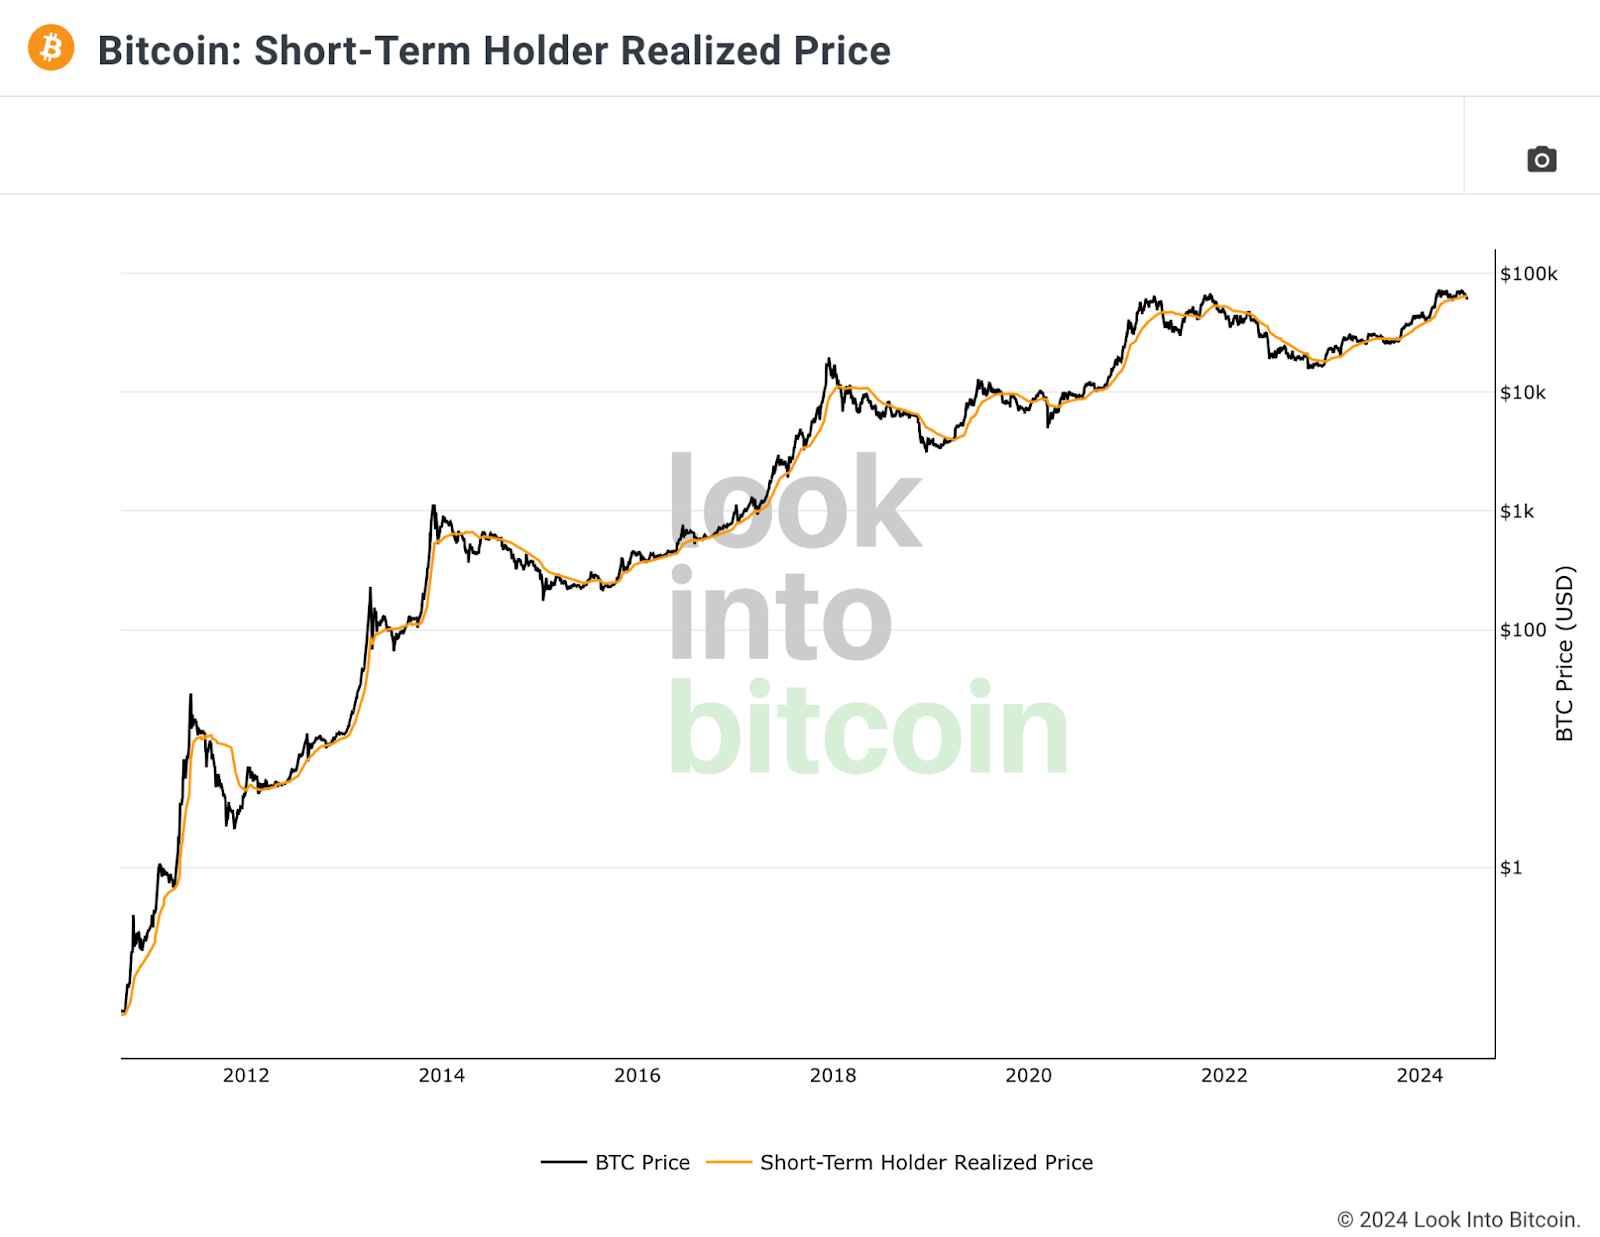
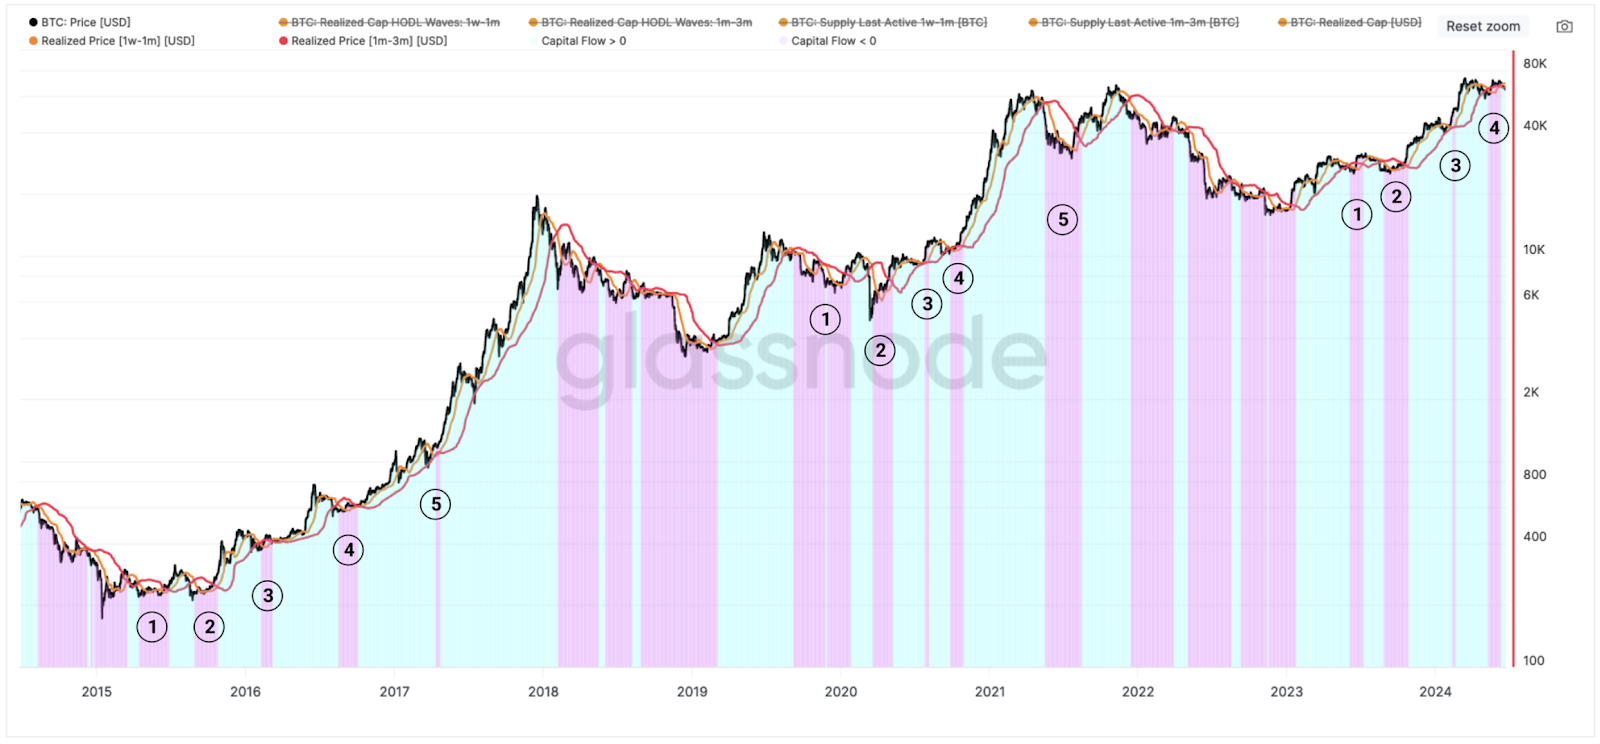 Bitcoin capital flow by STHs. Source:
 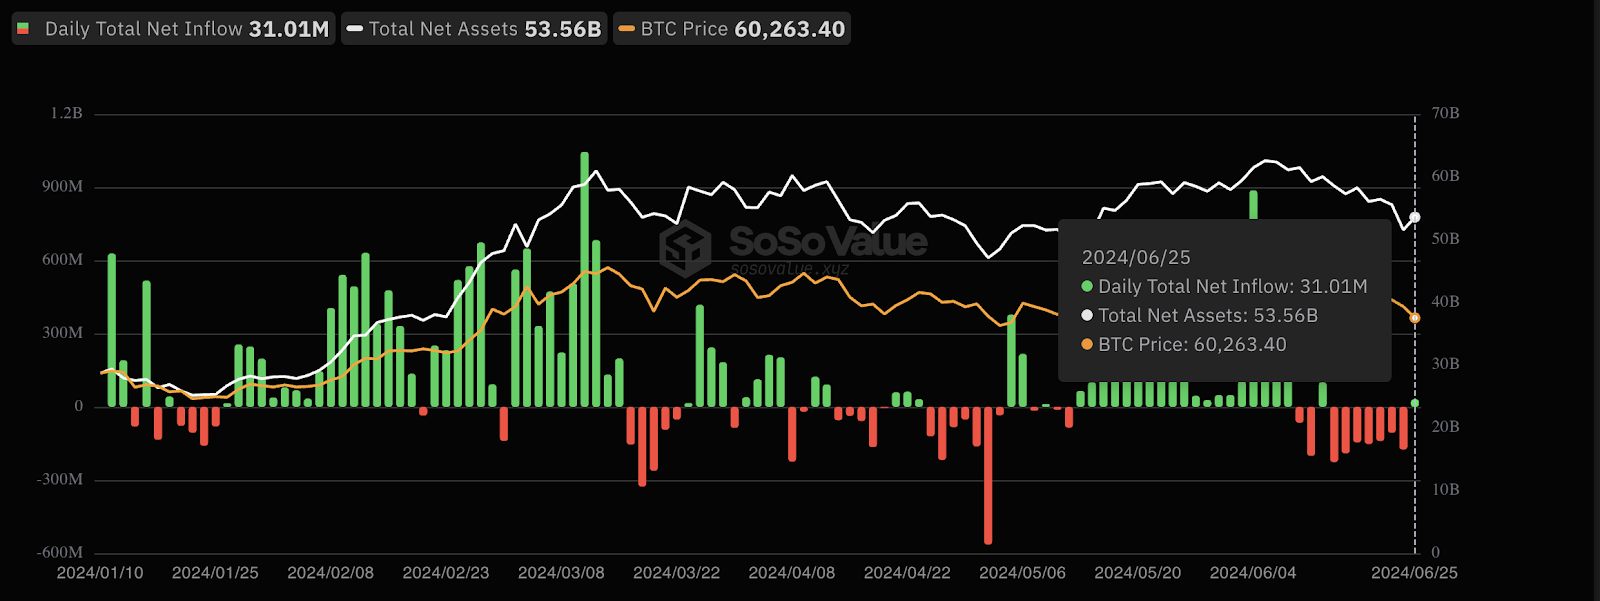 Total Bitcoin spot ETF net inflow. Source: