
There are five key on-chain indicators that suggest a bullish outlook for the price of Bitcoin. With market dominance above 54% and miner revenue per hash still strong, the data points to more potential gains ahead.
Bitcoin market dominance is above 56%
Historically, when Bitcoin (BTC) dominates the crypto market, it’s often a sign of a bull market. Traders typically sell their altcoins during bear markets, which increases Bitcoin’s market share.
Conversely, when Bitcoin’s dominance drops and the altcoin season begins, it indicates that the bull market is nearing its end.
As of May 2024, according to CoinMarketCap, Bitcoin’s dominance is still high at over 54%. Since October 2023, Bitcoin’s market share has remained above 50%.
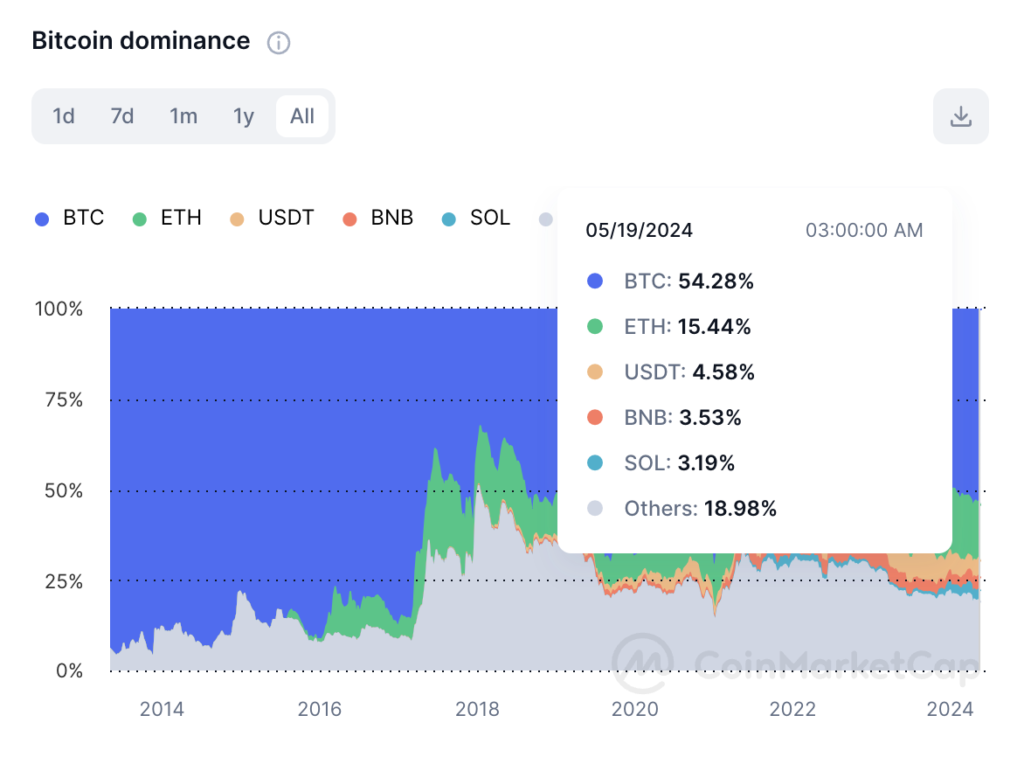
Source: CoinMarketCap
Bitcoin’s market dominance and its correlation to a period of bull run
- In mid-2015, after a prolonged bear market, Bitcoin’s dominance increased from around 40% to over 60%, which preceded the 2016-2017 bull run.
- In 2017, Bitcoin’s dominance rose from 37% in January to 66% by June, before the famous bull run that culminated in Bitcoin reaching nearly $20,000 by December.
- After the 2018 bear market, Bitcoin’s dominance grew from around 33% in January 2018 to over 70% by September 2019, preceding the 2020-2021 bull run.
- During the market recovery in early 2019, Bitcoin’s dominance steadily climbed from around 50% in January to over 70% by September.
- In late 2020, Bitcoin’s dominance surged above 50%, signalling the start of a major bull run that saw Bitcoin’s price rise from around $10,000 in September 2020 to over $60,000 by April 2021.
Bitcoin MVRV Z score under six
The Bitcoin Market Value to Realized Value (MVRV Z) score is a measure that compares Bitcoin’s current market value to its historical average.
This score tends to peak around six during market cycles. Currently, the MVRV Z score is below three and hasn’t exceeded six since March 2021, according to LookIntoBitcoin.
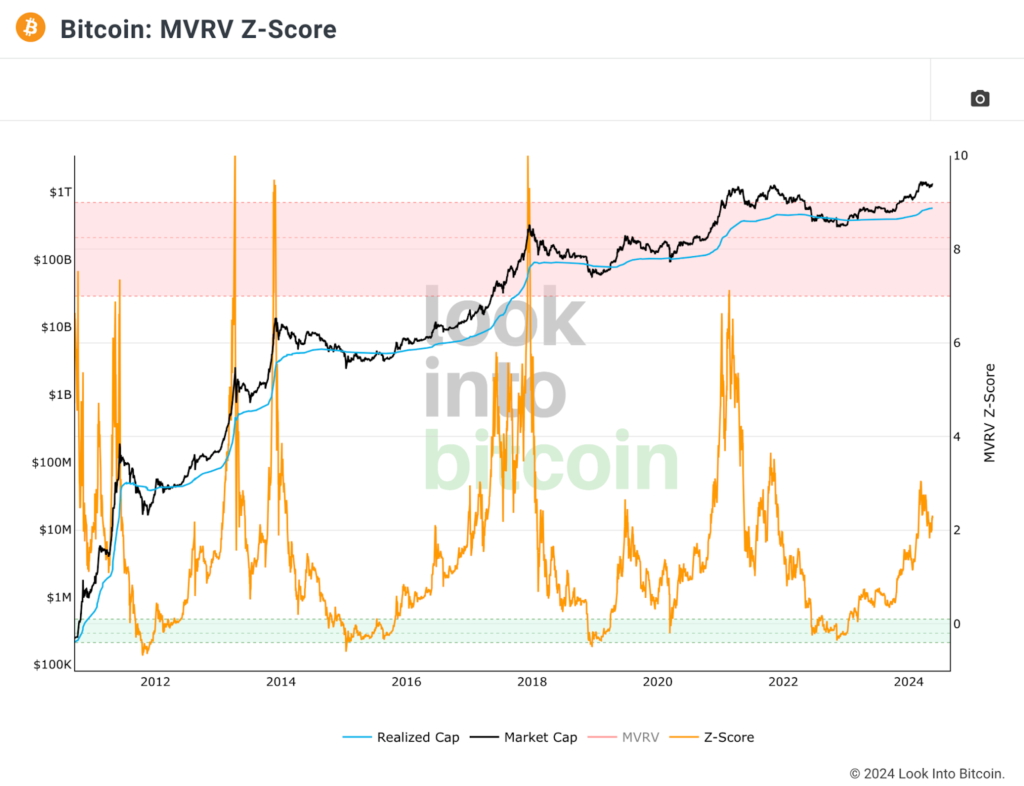
Source: LookIntoBitcoin
Puell multiple not above three
The Puell Multiple is another indicator used to identify market cycle peaks. It’s calculated by dividing the daily value of Bitcoin mined by the yearly moving average of that value.
According to Coinglass, the Puell Multiple fell below one after the halving on April 20. Peaks above three are usually seen at cycle tops, and the highest it reached during the 2024 price surge in mid-March was 2.4.
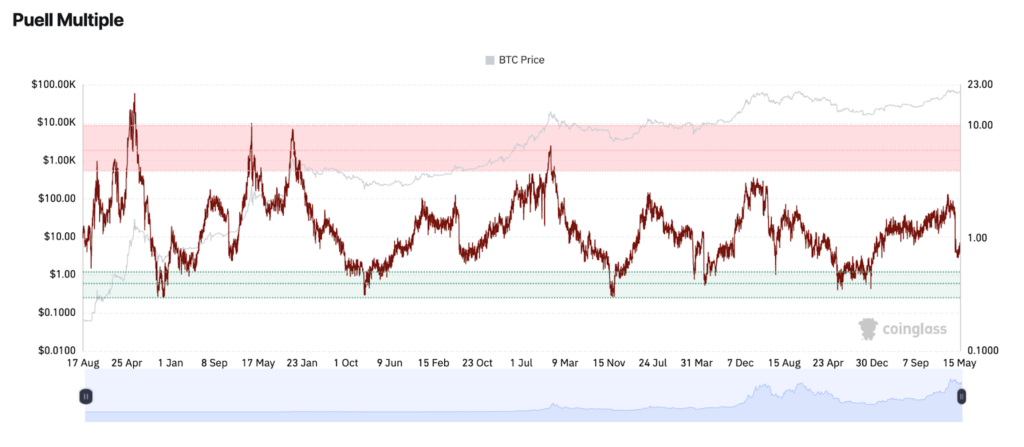
Source: Coinglass
Hodl waves
Charts that analyse the amount of Bitcoin held by different groups, known as hodl waves, also suggest a bullish outlook for Bitcoin.
Realized cap hodl waves provide insights into how much Bitcoin is held by recent buyers versus long-term holders. A decline in peaks among newer holders indicates that selling pressure might have lessened, potentially paving the way for further gains.
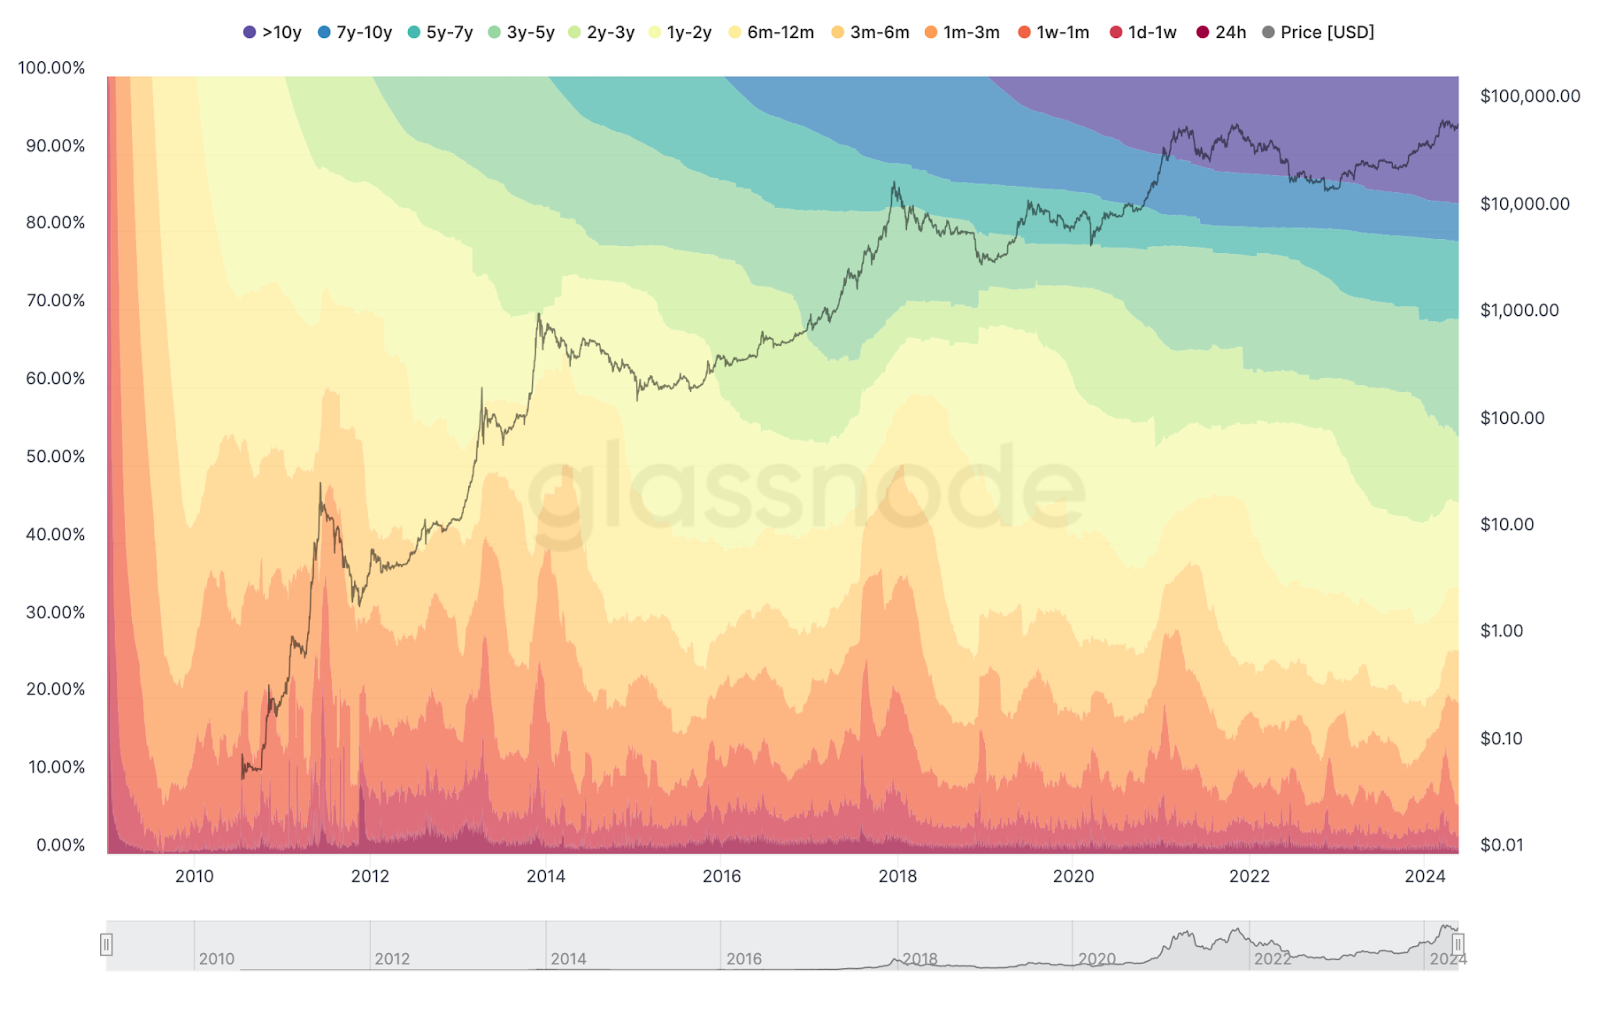
Source: Glassnode
Bitcoin miner revenue per hash
Another bullish indicator is the miner revenue per hash, which tracks how much money Bitcoin miners earn.
A terahash (TH/s) is a unit of measurement used in cryptocurrency mining to indicate the speed at which a computer can process complex calculations. Specifically, it represents one trillion (1,000,000,000,000) hash calculations per second.
The higher the terahash rate, the more calculations a miner can perform, increasing the chances of successfully mining a block and earning rewards.
Although this metric tends to decline as network difficulty increases, past spikes to $0.3 per terahash have coincided with market peaks. Currently, it suggests miners are still profiting well.
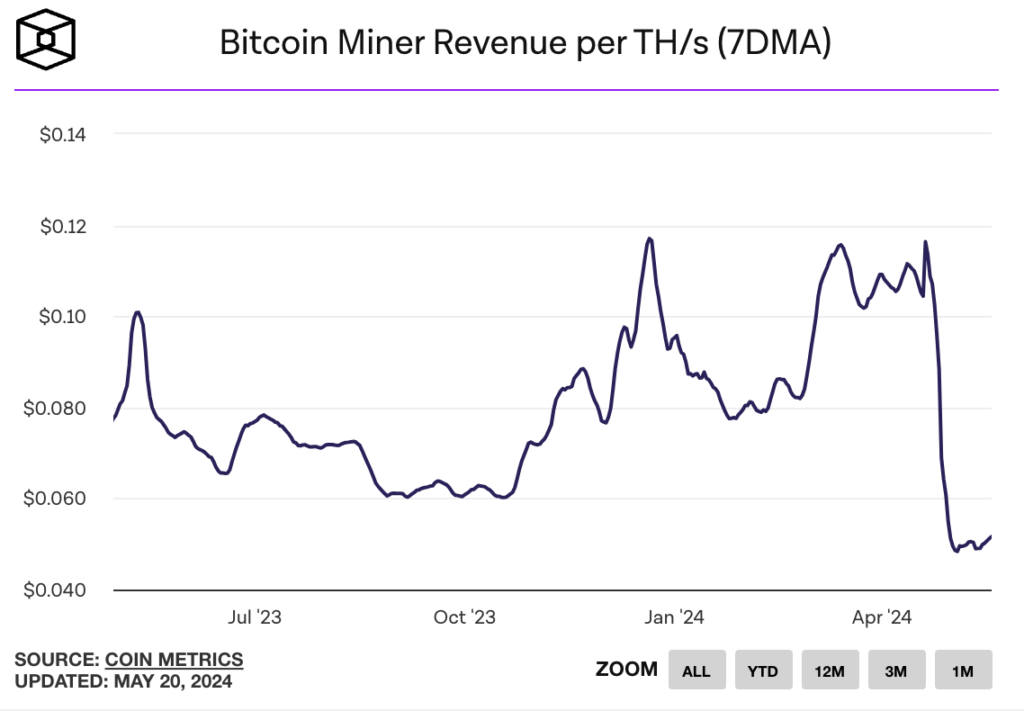
Source: TheBlock
Signs of a potential market peak
Despite these bullish signals, some metrics suggest the market might be overheating. The Realized Hodl (RHODL) ratio compares the price of recently bought Bitcoin to that of Bitcoin bought one to two years ago.
If new buyers are paying significantly more than long-term holders, it could indicate a market peak. This ratio signalled a peak in March.
The Cumulative Value-Days Destroyed (CVDD) metric also appears to have peaked.
CVDD measures the cumulative value of Bitcoin moved from older hands to new hands relative to the market age. A sudden movement of old coins can signal a market peak.
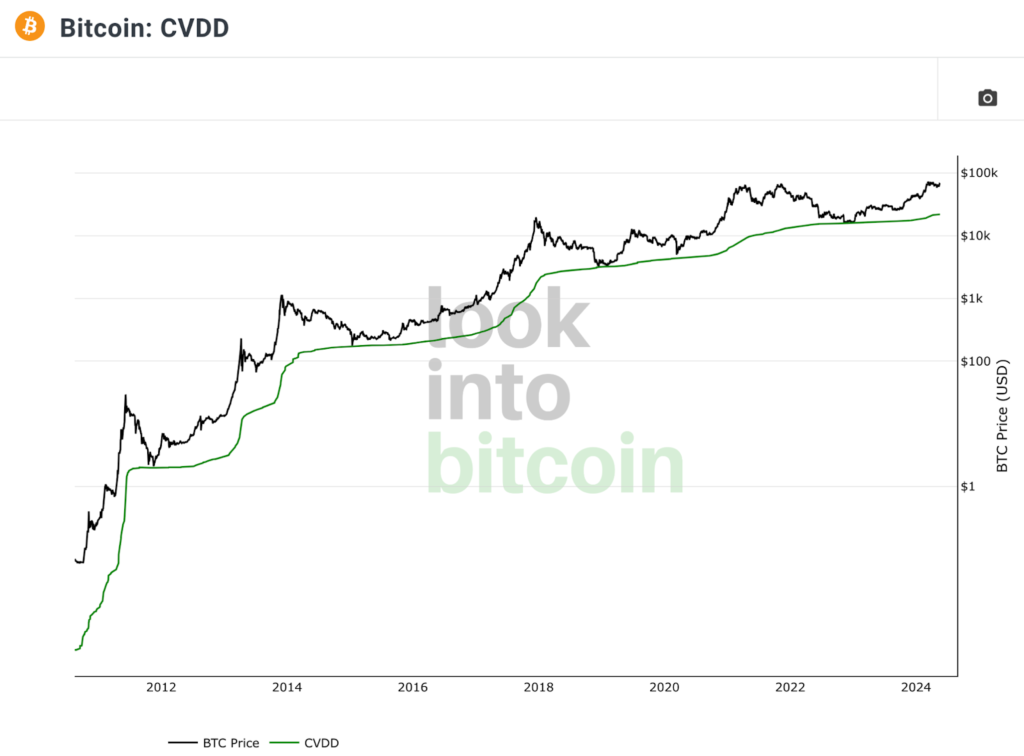
Source: LookIntoBitcoin
What’s next for Bitcoin’s price?
Given the current on-chain indicators, it looks like Bitcoin’s price is set to continue rising. High market dominance, favourable MVRV Z score, Puell Multiple, hodl waves, and miner revenue all suggest a bullish trend.
Although some metrics hint at a potential market peak, the overall data indicates that Bitcoin’s price is likely to see further gains before any significant downturn.