
According to a report, the on-chain for DeFi apps has slowed down, but the industry has managed to retain most of its daily active users.
CoinGecko published a report for Q2 2022 that reveals the market trends and analysis for decentralized finance (DeFi). The most unexpected statistic is that the DeFi market experienced a 74.6% decline in Q2, but the user activity has remained relatively robust.
Cryptocurrency market chances in Q2 2022 (statistics)
- Top 30 cryptos market capitalization decreased by 55.9%, losing over half its value and falling below $1 trillion.
- The top 15 stablecoins lost almost a fifth of their market cap, -18.3% or -$33.9B
- The top 30 crypto market cap correlation with the S&P500 was 0.92 (that’s a high correlation).
- Bitcoin’s hash rate decreased by 1.7%
- +17.82% of total ETH Staked in Q2 2022. (Almost 13 million ETH was staked, representing roughly 11% of the total ETH supply).
- There was a 34.5% decrease in average daily DeFi Users compared to 1st April 2022
- The NFT trading volume decreased by 26% from Q1 to Q2 2022
DeFi market in Q2 2022
The CoinGecko report states that the total DeFi market cap dropped from $142 million (in Q1) to $36 million (in Q2). This was primarily due to the collapse of Terra’s stablecoin UST in May 2022.
Another worrying statistic is the increase in DeFi exploits, which has contributed significantly to this fall. Some of the most notable hacking events involved Inverse Finance and Rari, and the lost funds accumulated up to $1.2 million and $11,000,000, respectively. These attacks affected the token prices’ tremendously, and investors have also lost confidence in these protocols.
But it’s not all doom and gloom in the DeFi space. Although on-chain activity has slowed, the DeFi industry still retains most of its active users daily.
The DeFi daily active users decreased by only 34.5%, from 50,000 to 35,000 in Q2. There were also numerous instances that led to an increase in DeFi activity.
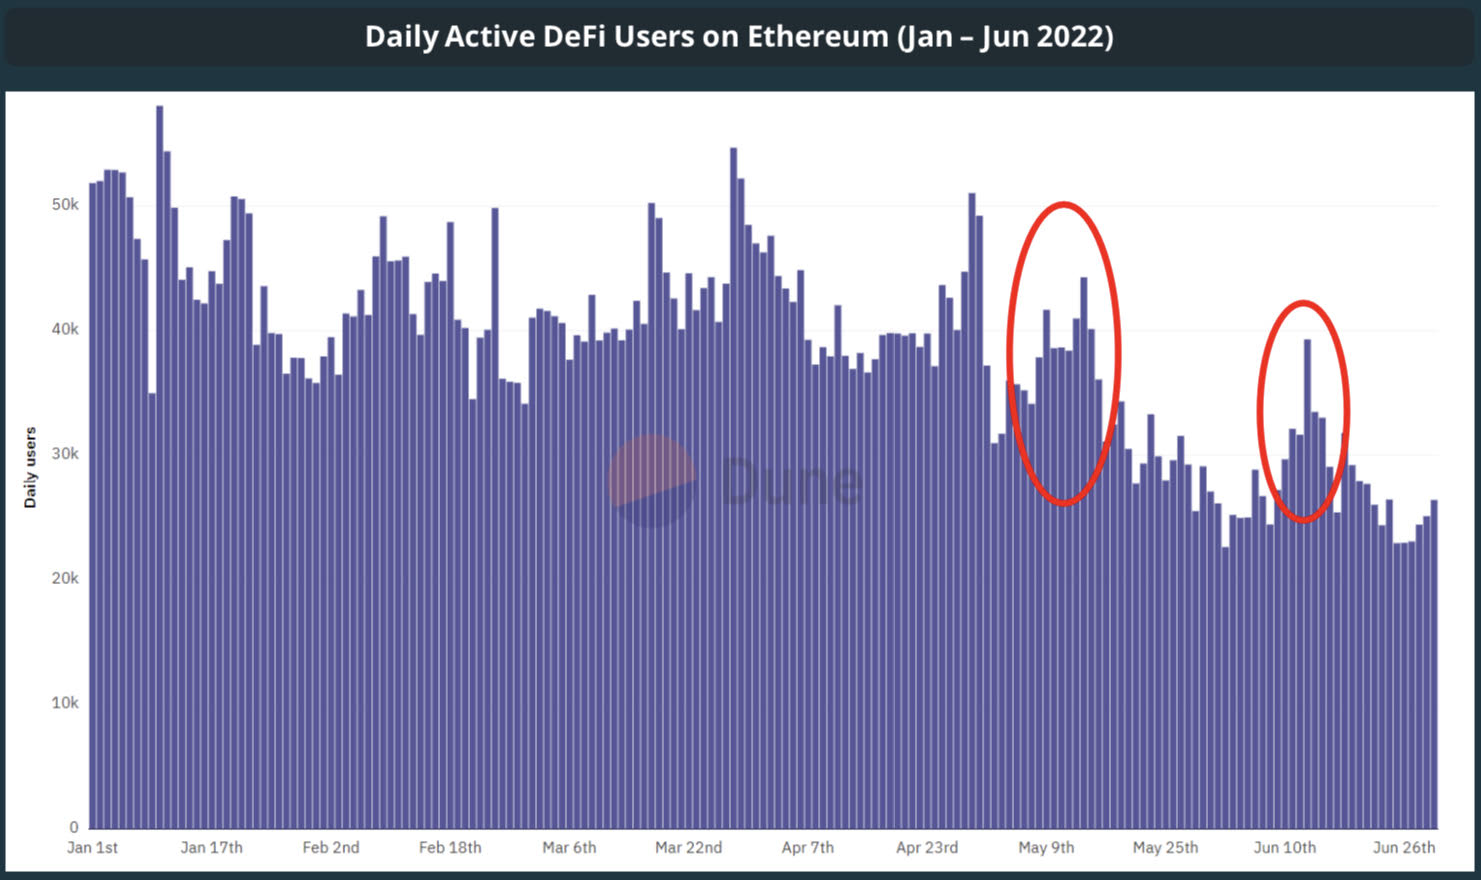
After Terra’s collapse, there was a spike in users’ on-chain activity. Of course, that could be explained by users who used Curve Finance or Uniswap to sell Terra (LUNA and USTC).
The second spike was seen in June when Celsius, a crypto lending platform, imposed withdrawal restrictions due to financial difficulties. Celsius filed for bankruptcy on July 12.
The users’ behavior is normal in both f these cases, as they were trying to escape the dramatic consequences of these protocols.
What’s happening to NFTs?
Also, the report found that the trading volume for nonfungible tokens (NFTs) decreased by 26.2.% reaching $7.6 billion since the same time last year.
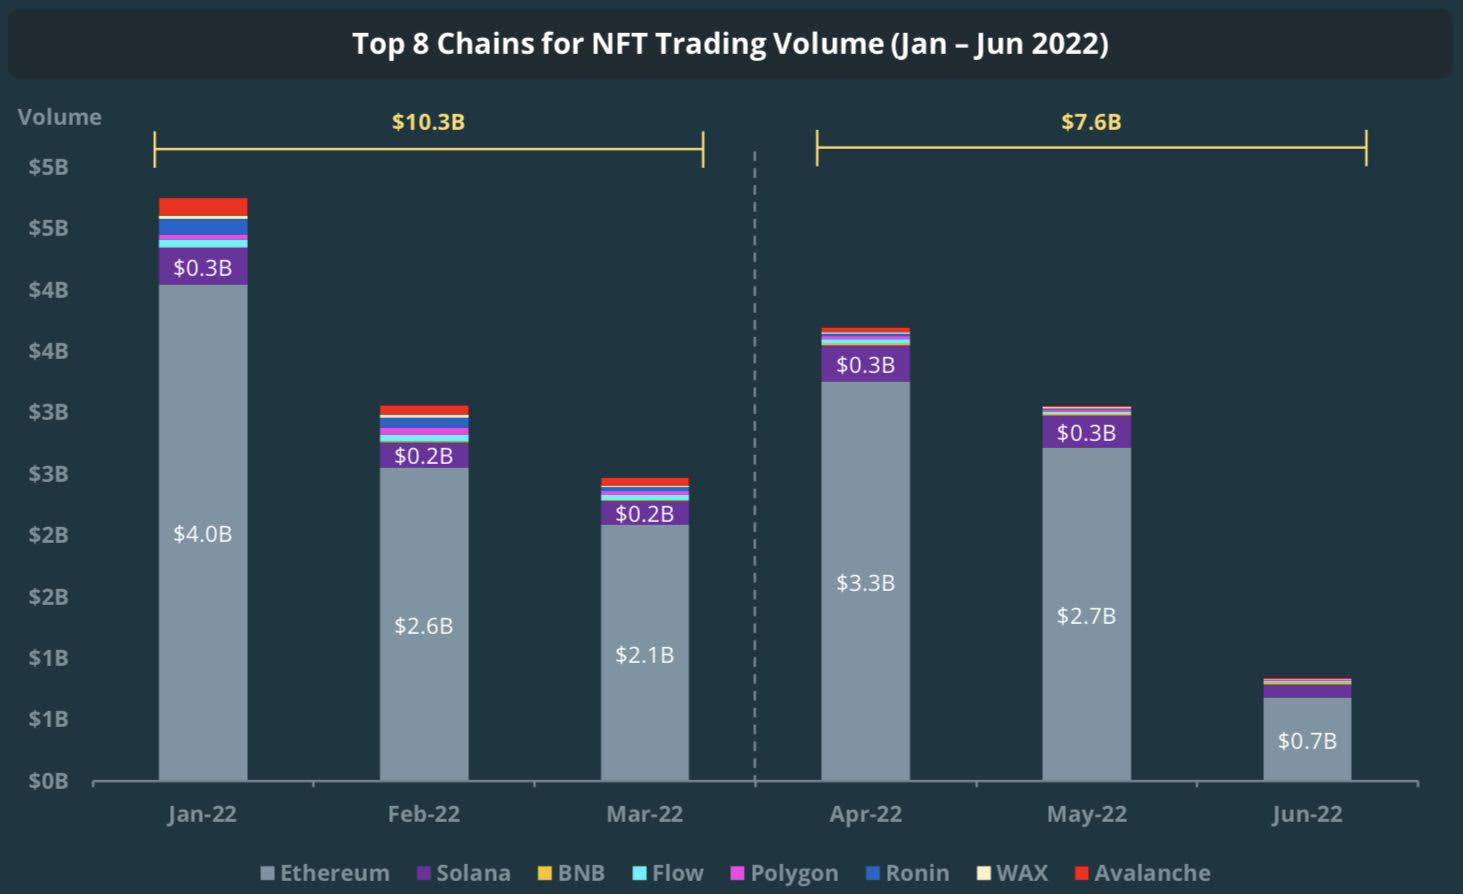
In June 2022, the NFT trading volumes reached $830 million. This coincided with the collapse of the floor prices of NFTs.
For the first time ever, we also witness a change in the NFT marketplaces’ arena.
OpenSea maintained its grip on the top spot, despite being in decline. In May and June, however, Magic Eden, X2Y2, seemed to have caught up and took turns to surpass OpenSea’s daily and weekly volumes.
Despite having a more advantageous fee structure, LooksRare & X2Y2 are still behind OpenSea. However, they are slowly gaining ground.
NFT trends in Q2 2022
It looks like the Play-to-Earn (P2E) games are gaining more popularity, and we can see it in the NFT trends.
Some of the most traded in-game NFT assets are Stepn’s shoes (move to earn game), GoblinTown, and Art Blocks.
It’s also important to note that Solana has been reducing Ethereum’s NFT share. It will be interesting to see if this momentum can last long-term.
Some of the rising NFT projects on Solana include OkayBears, Trippin’ Ape Tribe, and DeGods.